steml
Solar data for the age of AI.
steml turns imagery of the planet into structured, decision-ready data. We start with solar: what is installed on every roof, what capacity remains and where demand comes next, for lenders, energy providers and installers in any market.
stem: grow your data
Method
- 01Imagery
High-resolution aerial and satellite imagery from national mapping agencies and commercial providers. Our pilot runs on 25 cm official orthophotos.
- 02Detection
A computer-vision model segments solar arrays on every roof. Pools, greenhouses and shade structures are filtered out by colour checks, and every rejection is logged with its reason.
- 03Verification
Before a roof is recorded as having no panels, it is re-examined at 2× zoom, centred on the building. Low-confidence detections are flagged, never counted.
- 04Attribution
Each detection is matched to a building footprint (Overture Maps: OpenStreetMap and national cadastres), so every number traces back to a specific roof and image.
- 05Benchmarking
Adoption is measured per neighbourhood with 95% confidence intervals and compared with the city, the region and the most similar areas by housing type.
From the pilot: three real roofs
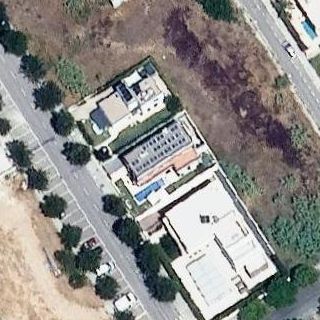
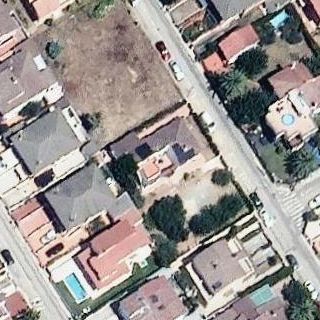
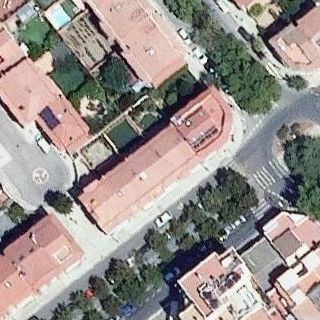
Cyan: building outline. White: detected array with model confidence. Yellow dotted: below threshold, sent to review. Orthophoto © Institut Cartogràfic i Geològic de Catalunya (ICGC), CC BY 4.0.
What we provide
- Building-level inventory
Installed / not installed / under review for every roof over 40 m², with roof area and image date.
- Untapped capacity
Each roof without panels sized in kWp, annual generation (kWh) and annual savings in local currency.
- Adoption benchmarks
Penetration by neighbourhood and municipality, with confidence intervals and like-for-like peer comparison.
- Segment signals
Single-family vs. multi-unit housing, so self-consumption and shared-solar opportunities are sized separately.
- Prioritised targets
Ranked areas and roof lists for origination, with a plain-language rationale for each.
- Audit trail
Every figure links to its source tile, detection score and model version, ready for due diligence.
Who it is for
- Banks & lenders
Size the market for green mortgages and solar loans, target origination, and report rooftop-solar exposure across a portfolio.
- Energy providers & utilities
See where self-consumption is growing, plan for distributed generation, and find customers for solar, batteries and community schemes.
- Installers & developers
Know which streets are under-served before sending a single salesperson.
Coverage & delivery
- Coverage
- Global by design: any market with high-resolution imagery and building outlines. Live pilot in Cambrils, Spain. New markets on request.
- Refresh
- Quarterly releases, folding in new imagery as it is captured and official installation registries where they exist.
- Delivery
- API, CSV and GIS layers (GeoJSON, GeoPackage).
- Validation
- Model output reproduces the reference implementation on test imagery. Counts are cross-checked against official installation registries.
Request early access
Tell us where you operate and what you need. We'll be in touch when data for your area is ready.
Solar is our first dataset. If you need something else measured from above (buildings, roofs, land use, infrastructure), tell us in the company field and we'll scope it.